Daily statistics
How warm or cold was it yesterday compared to how it used to be? Here we present daily temperature data from Uppsala and compare with a reference period from 1722 to 2022, updated once per day.
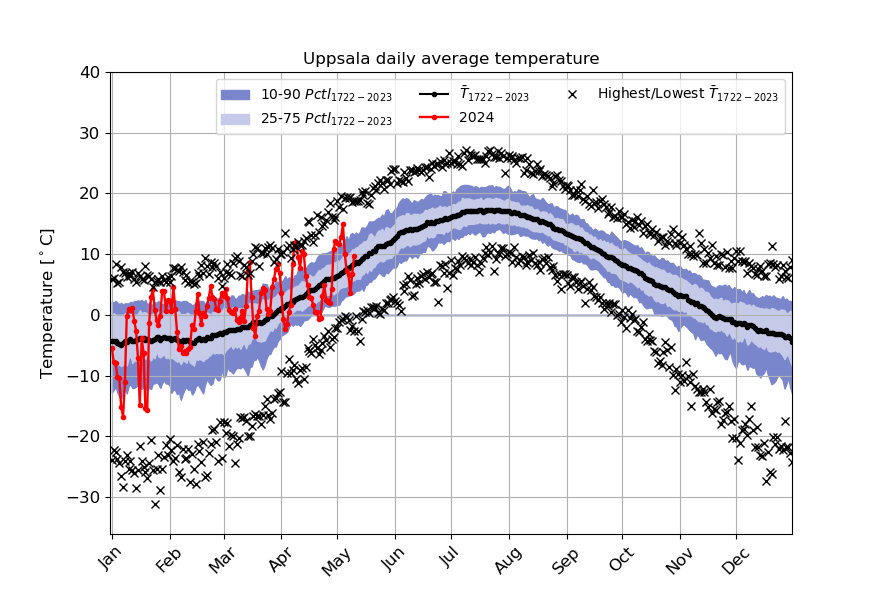
Daily average temperatures from Uppsala for the current year (red) and the reference period (black line). Light blue indicates 'normal' variation for the reference period (25-75 percentile). Dark blue indicates warmer/colder than normal, white indicates much warmer/colder than normal. Crosses mark record min/max of daily temperature averages for the reference period
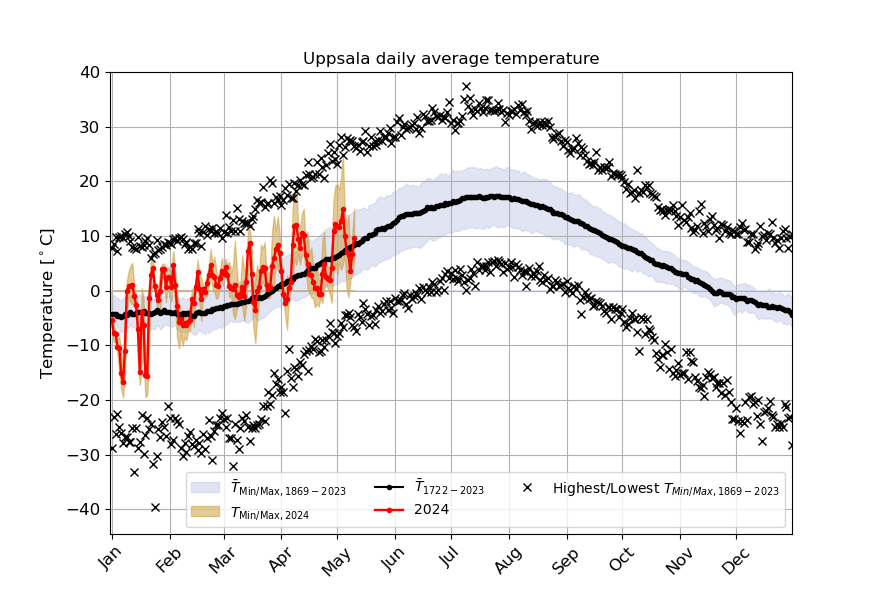
Daily average temperatures from Uppsala for the current year (red) and the reference period (black line). Yellow indicates daily (00-24) min/max temperature interval. Light blue indicates average daily (00-24) min/max interval over the reference period. Black crosses mark record min/max temperatures each day for the reference period.
Daily min/max temperatures are available since 1868-08-01
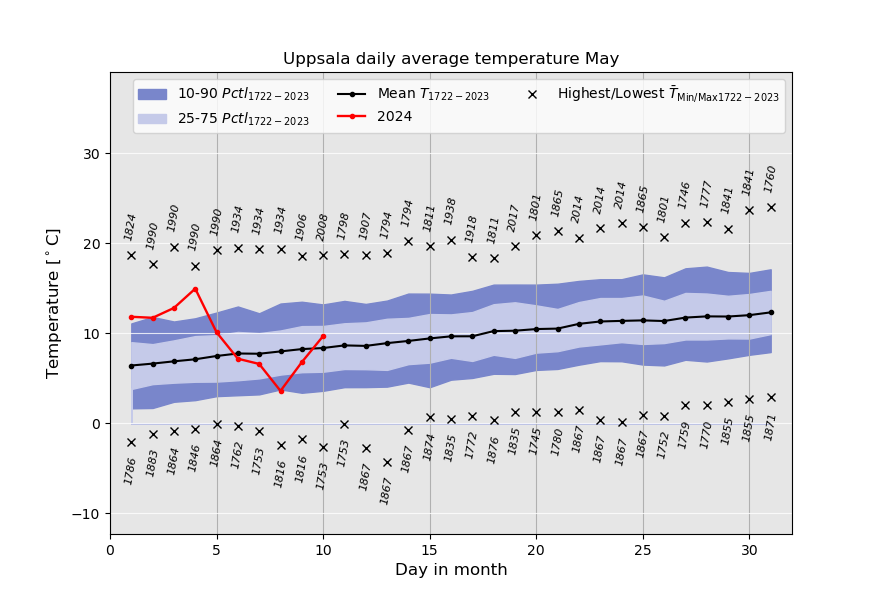
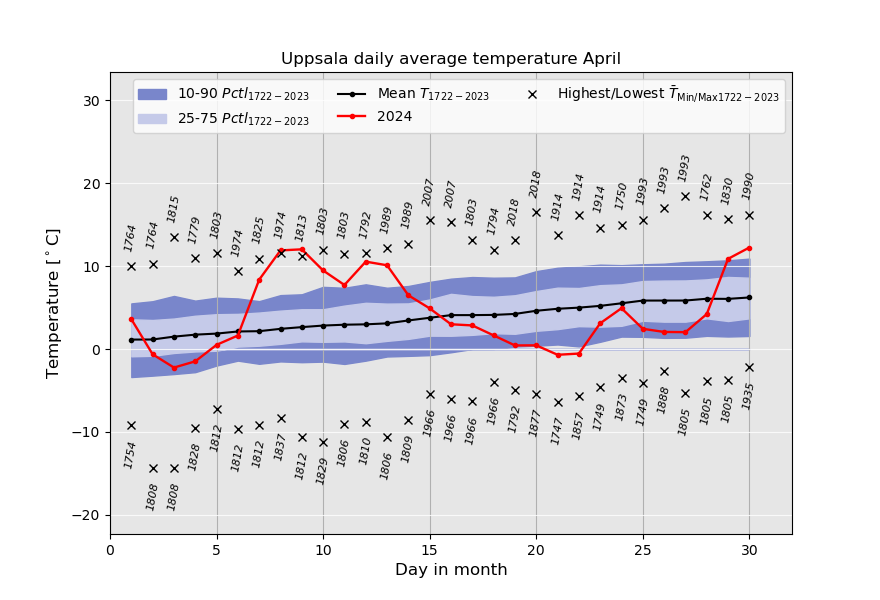
Daily average temperatures from Uppsala for the current month (red) and the reference period for the current month (black line). Light blue indicates 'normal' variation for the reference period (25-75 percentile). Dark blue indicates warmer/colder than normal, grey indicates much warmer/colder than normal. Crosses mark record min/max daily temperature averages for the reference period. Year of the record is also indicated.
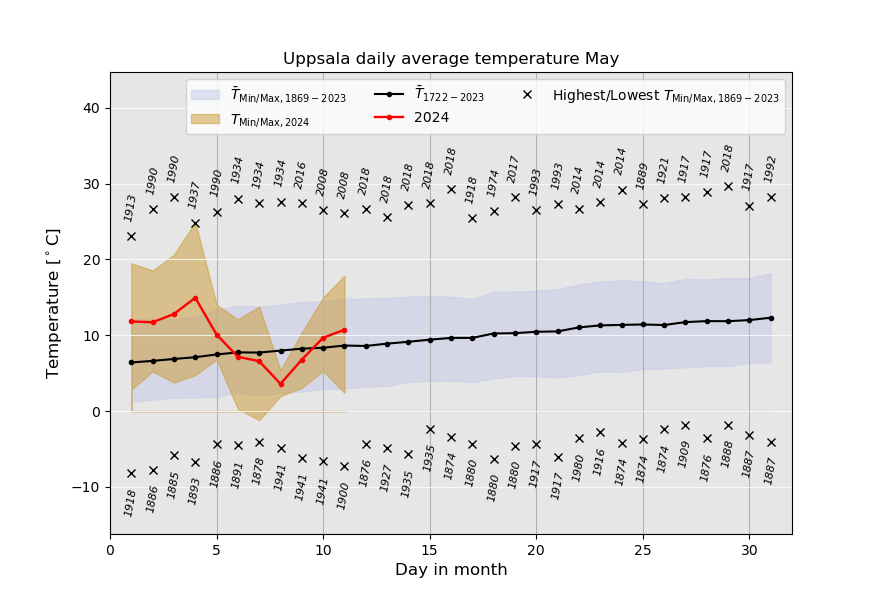
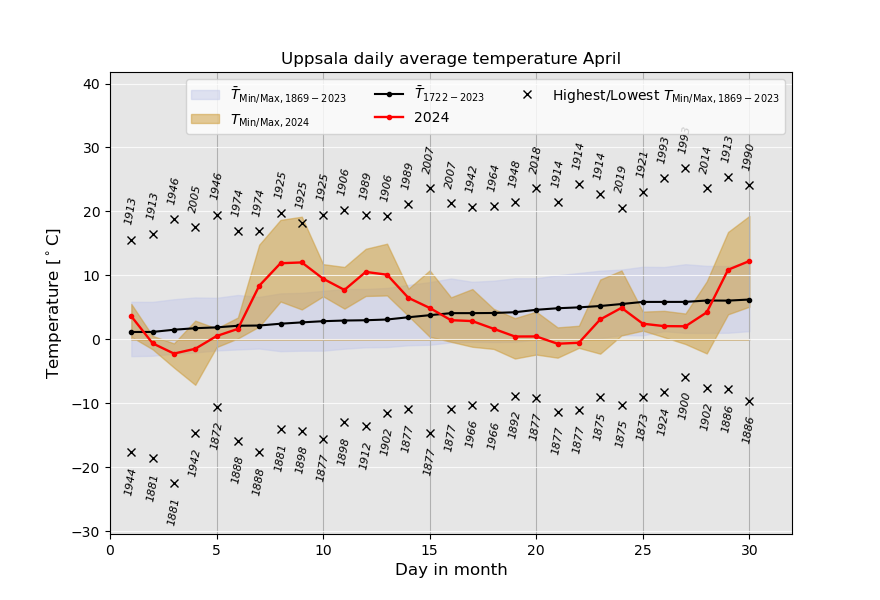
Daily average temperatures from Uppsala for the current month (red) and the reference period for the current month (black line) . Yellow indicates daily (00-24) min/max temperature interval. Light blue indicates average daily (00-24) min/max interval over the reference period. Black crosses mark record min/max temperatures each day for the reference period. Year of the record is also indicated.
Daily min/max temperatures are available since 1868-08-01
Previous month
Daily average temperatures from Uppsala for the previous month (red) and the reference period for the current month (black line). Light blue indicates 'normal' variation for the reference period (25-75 percentile). Dark blue indicates warmer/colder than normal, grey indicates much warmer/colder than normal. Crosses mark record min/max daily temperature averages for the reference period
Daily average temperatures from Uppsala for the previous month (red) and the reference period for the current month (black line) . Yellow indicates daily (00-24) min/max temperature interval. Light blue indicates average daily (00-24) min/max interval over the reference period. Black crosses mark record min/max temperatures each day for the reference period.
Daily min/max temperatures are available since 1868-08-01